> For the complete documentation index, see [llms.txt](https://docs.economize.cloud/llms.txt). Markdown versions of documentation pages are available by appending `.md` to page URLs; this page is available as [Markdown](https://docs.economize.cloud/google-cloud/bigquery.md).
# Analyzing BigQuery costs by linking the logging export
Follow the below steps to create and integrate a logging sink with Economize, allowing you to analyze BigQuery costs within [Reports](/product-features/reports.md).
## Step 1: Create a Logging sink
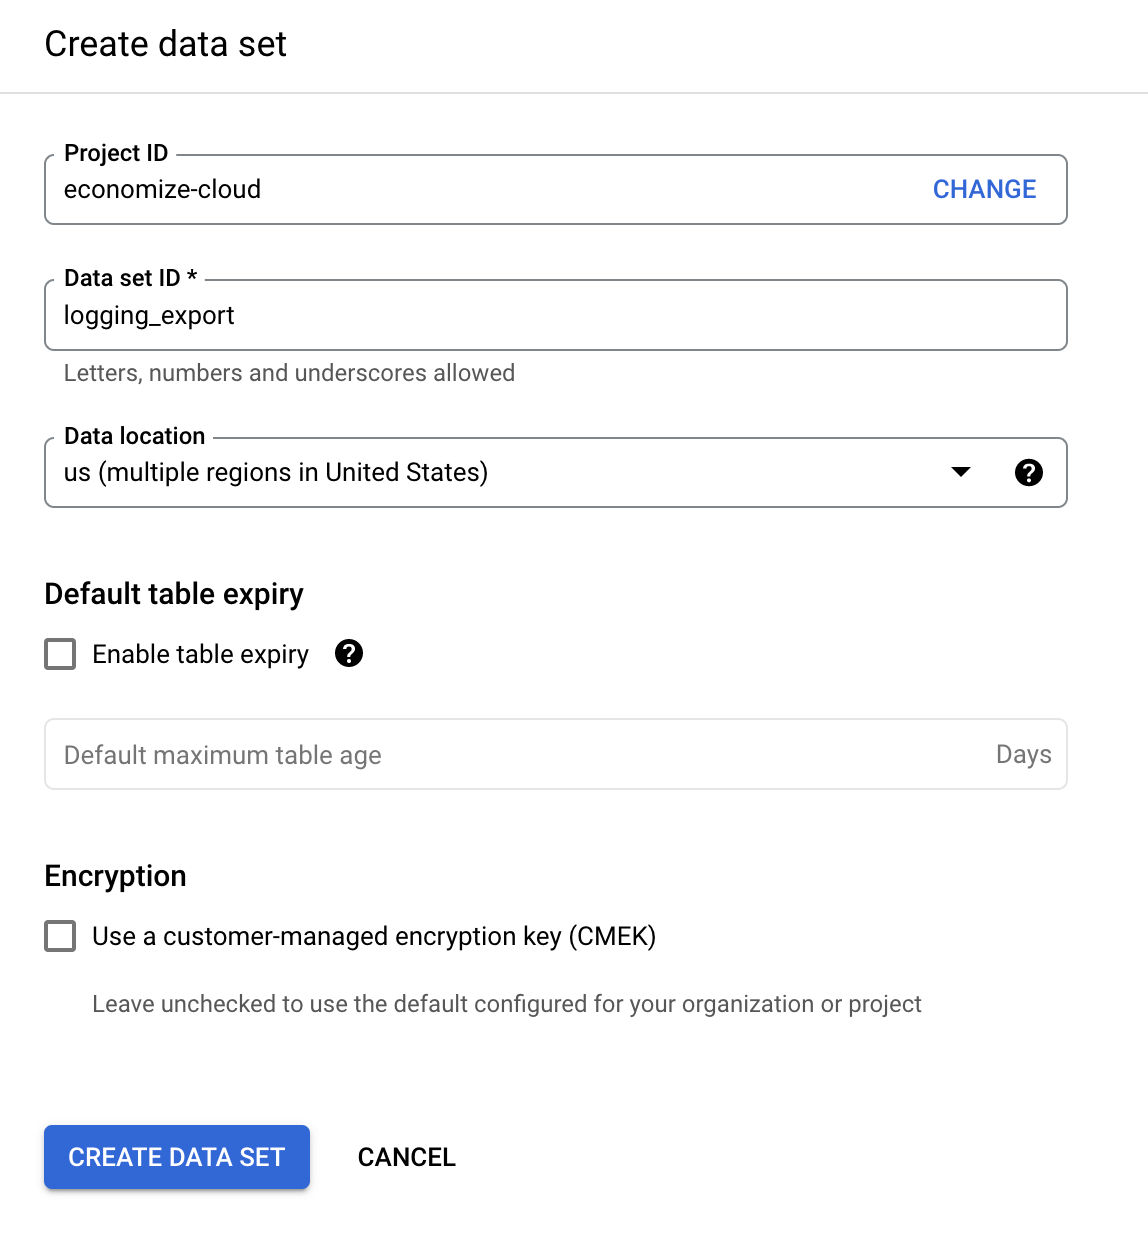
1. Navigate to the [BigQuery console](https://console.cloud.google.com/bigquery) to create a new dataset named **logging\_export** in the same project where you created the billing export dataset during onboarding.
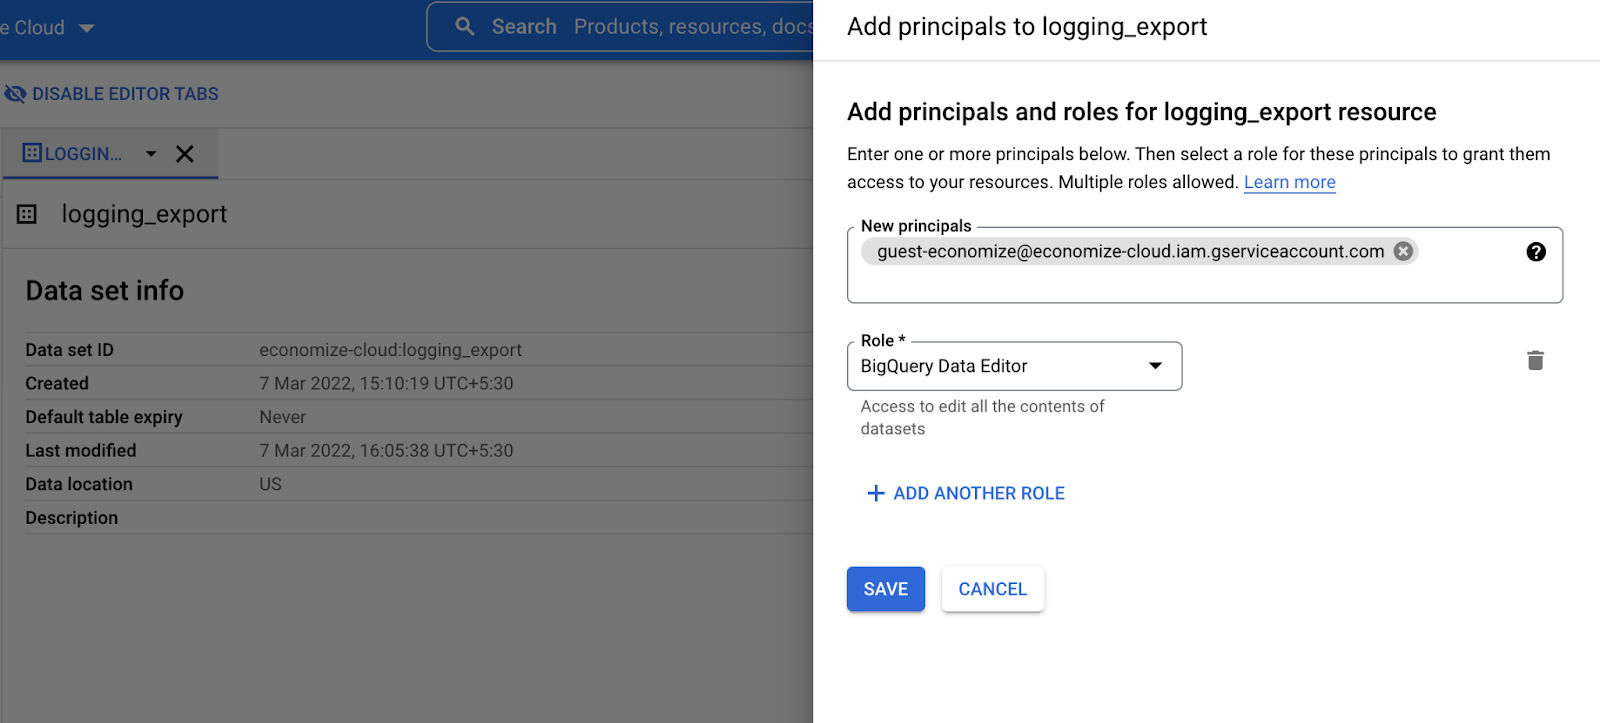
2. For this newly created dataset configure the permission as follows:
* Select the three vertical dots next to the dataset name, then click **Share**.
* On the **Share permissions** panel that appears on the right, click **+ ADD PRINCIPAL**.
* In the **New principals** field, under **Add principals**, paste the value of the service account based on your selected access method during onboarding.
* In the **Role** field, under **Assign roles**, search for and select **BigQuery Data Editor**.
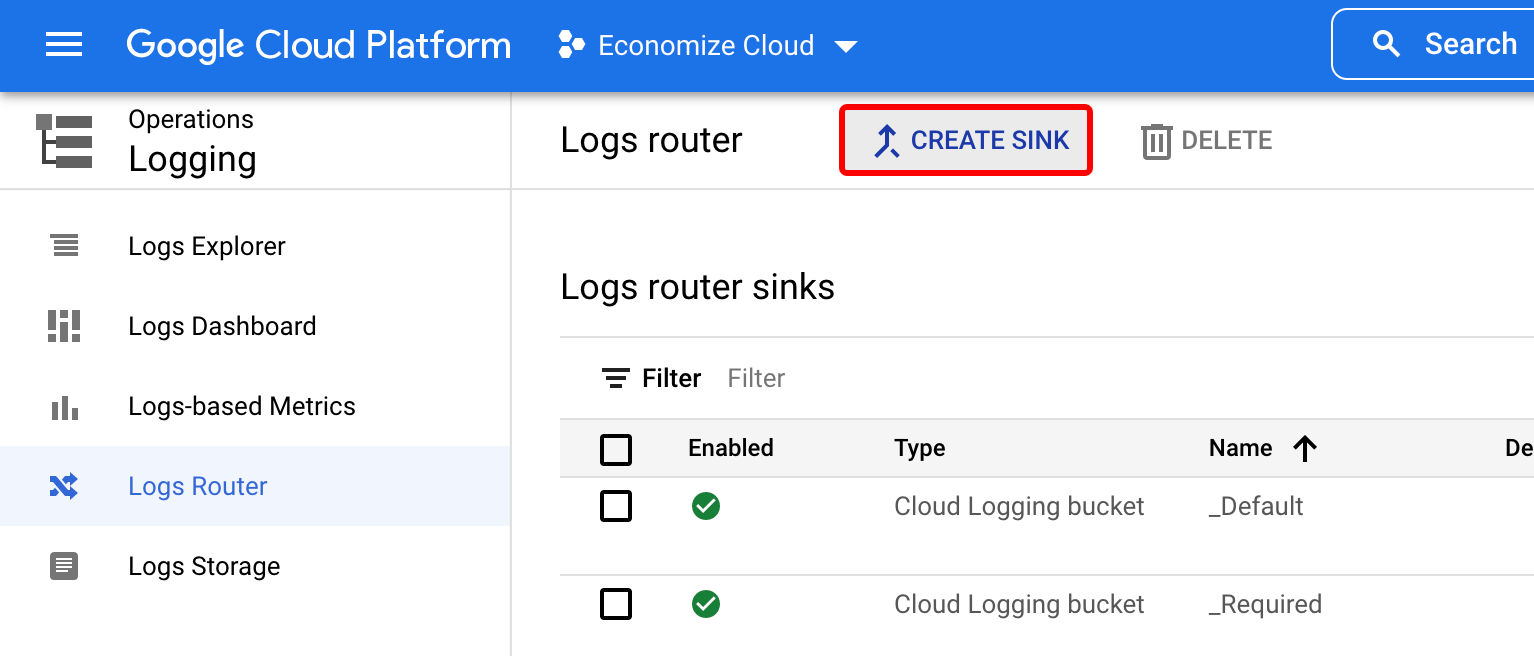
3. Now go to the [Log router](https://console.cloud.google.com/logs/router) and select **Create Sink.**
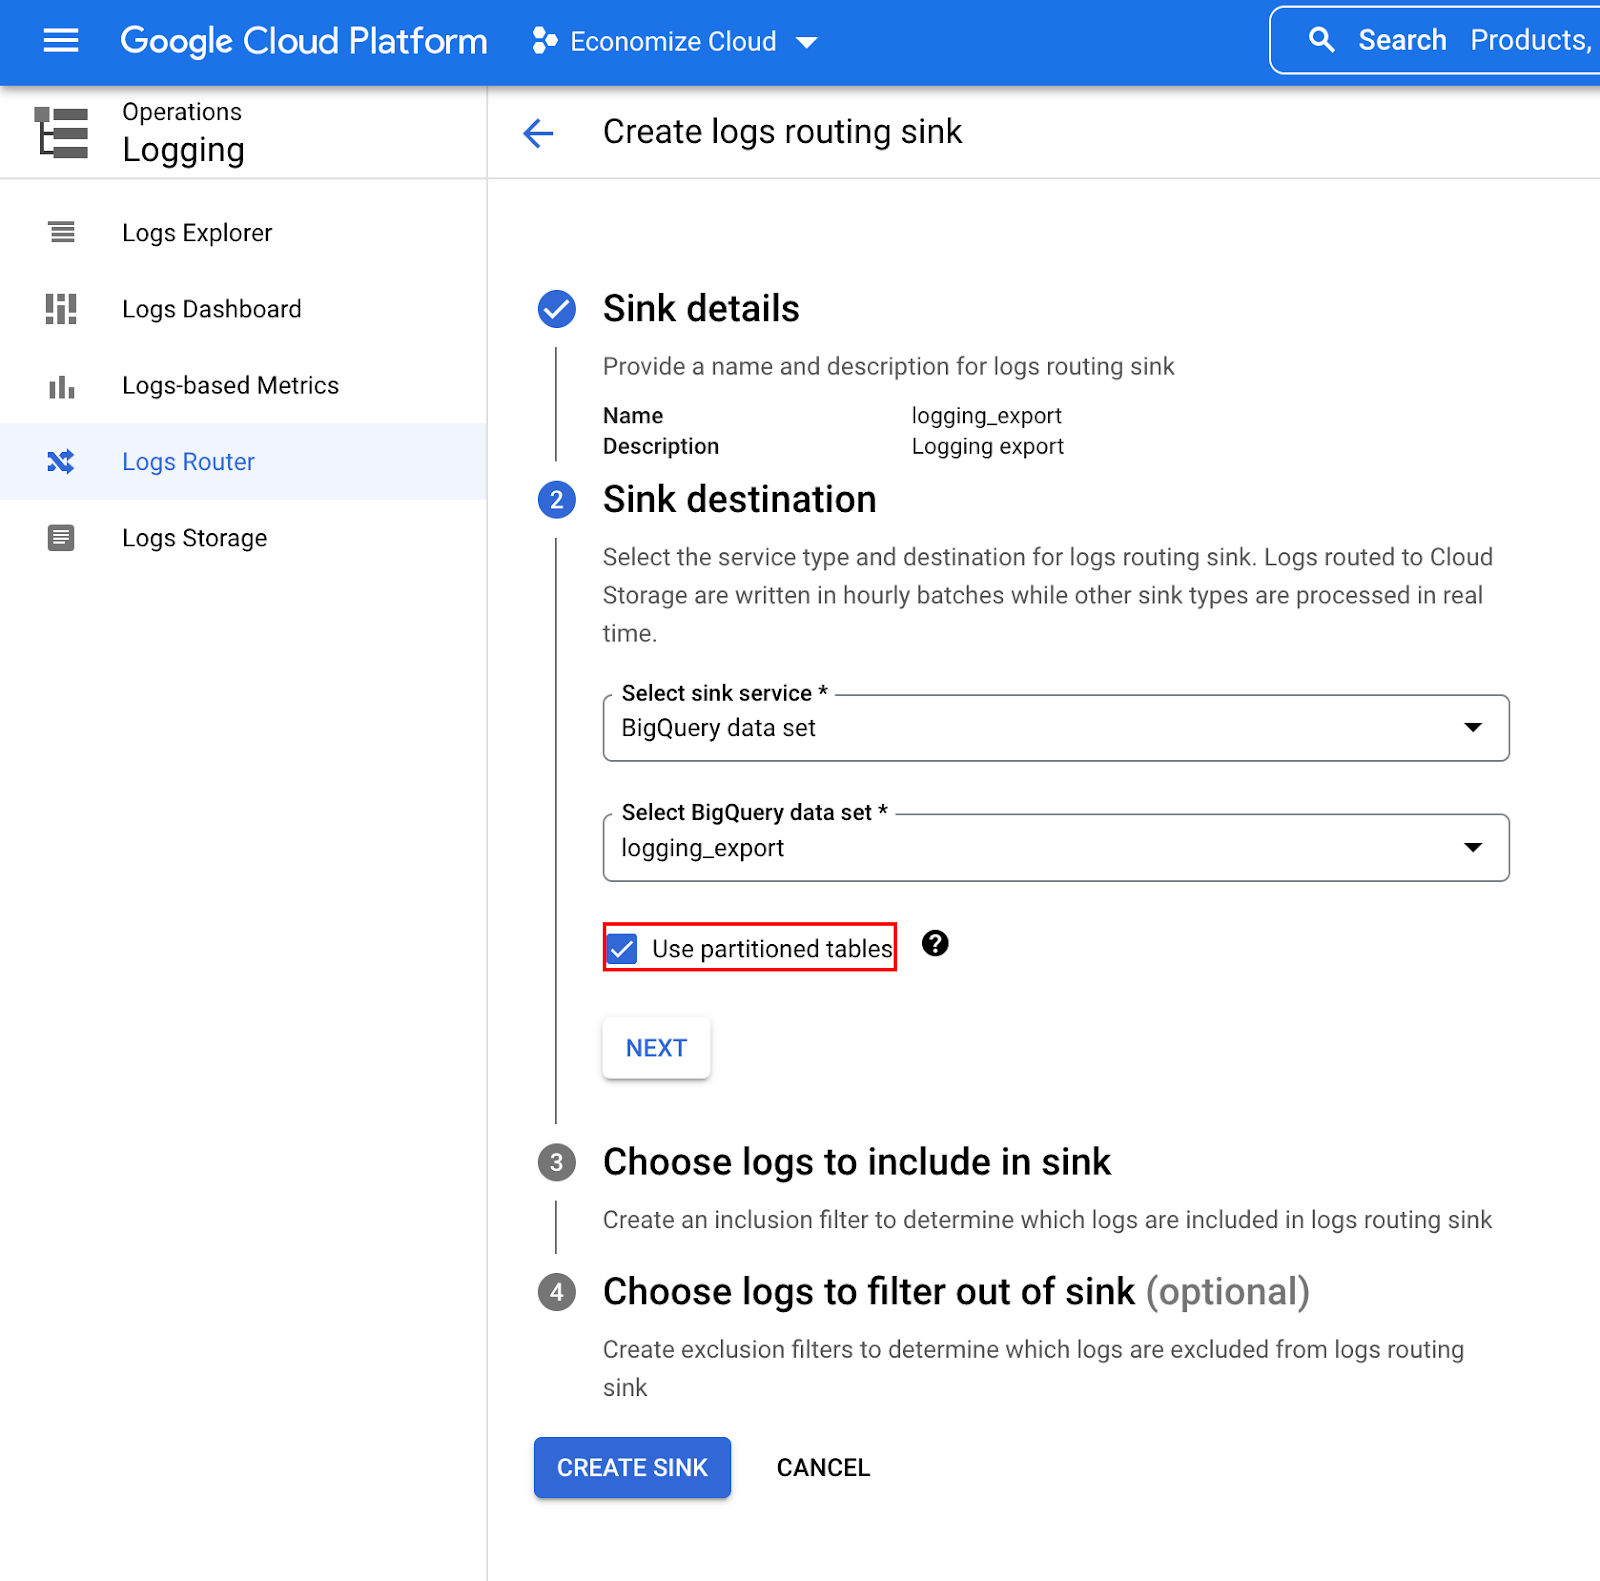
4. Provide a sink name and select the BigQuery dataset **logging\_export** that you created earlier as the destination.
5. Click on the **Use partitioned tables** checkbox in the form.
6. Provide the below inclusion filter in Step 3 when asked to **Choose logs to include in sink**.
{% code title="Inclusion filter" overflow="wrap" fullWidth="false" %}
```
protoPayload.serviceName="bigquery.googleapis.com" AND protoPayload.methodName="jobservice.jobcompleted"
```
{% endcode %}
7. Leave the exclusion filter empty and click on **Create Sink**.
## Step 2: Integrate Logging sink with Economize
1. Navigate to the [**Projects page**](https://www.economize.cloud/app/settings/projects) from the settings of the Economize console.
2. Click on the pen icon for the project you wish to analyze the BigQuery costs.
3. Enter the **Dataset ID** of the BigQuery dataset you created in step 1 in the following text field.
4. Test your connection to the dataset by clicking on the test button.
5. Click on the **Save Changes** button.
{% hint style="success" %}
**SUCCESS**
You can now navigate to the [Reports](https://www.economize.cloud/app/gcp/reports) within the Economize console and start analyzing the BigQuery costs.
{% endhint %}

 2. For this newly created dataset configure the permission as follows:
* Select the three vertical dots next to the dataset name, then click **Share**.
* On the **Share permissions** panel that appears on the right, click **+ ADD PRINCIPAL**.
* In the **New principals** field, under **Add principals**, paste the value of the service account based on your selected access method during onboarding.
* In the **Role** field, under **Assign roles**, search for and select **BigQuery Data Editor**.
2. For this newly created dataset configure the permission as follows:
* Select the three vertical dots next to the dataset name, then click **Share**.
* On the **Share permissions** panel that appears on the right, click **+ ADD PRINCIPAL**.
* In the **New principals** field, under **Add principals**, paste the value of the service account based on your selected access method during onboarding.
* In the **Role** field, under **Assign roles**, search for and select **BigQuery Data Editor**.
 3. Now go to the [Log router](https://console.cloud.google.com/logs/router) and select **Create Sink.**
 4. Provide a sink name and select the BigQuery dataset **logging\_export** that you created earlier as the destination.
5. Click on the **Use partitioned tables** checkbox in the form.
4. Provide a sink name and select the BigQuery dataset **logging\_export** that you created earlier as the destination.
5. Click on the **Use partitioned tables** checkbox in the form.
 6. Provide the below inclusion filter in Step 3 when asked to **Choose logs to include in sink**.
{% code title="Inclusion filter" overflow="wrap" fullWidth="false" %}
```
protoPayload.serviceName="bigquery.googleapis.com" AND protoPayload.methodName="jobservice.jobcompleted"
```
{% endcode %}
6. Provide the below inclusion filter in Step 3 when asked to **Choose logs to include in sink**.
{% code title="Inclusion filter" overflow="wrap" fullWidth="false" %}
```
protoPayload.serviceName="bigquery.googleapis.com" AND protoPayload.methodName="jobservice.jobcompleted"
```
{% endcode %}
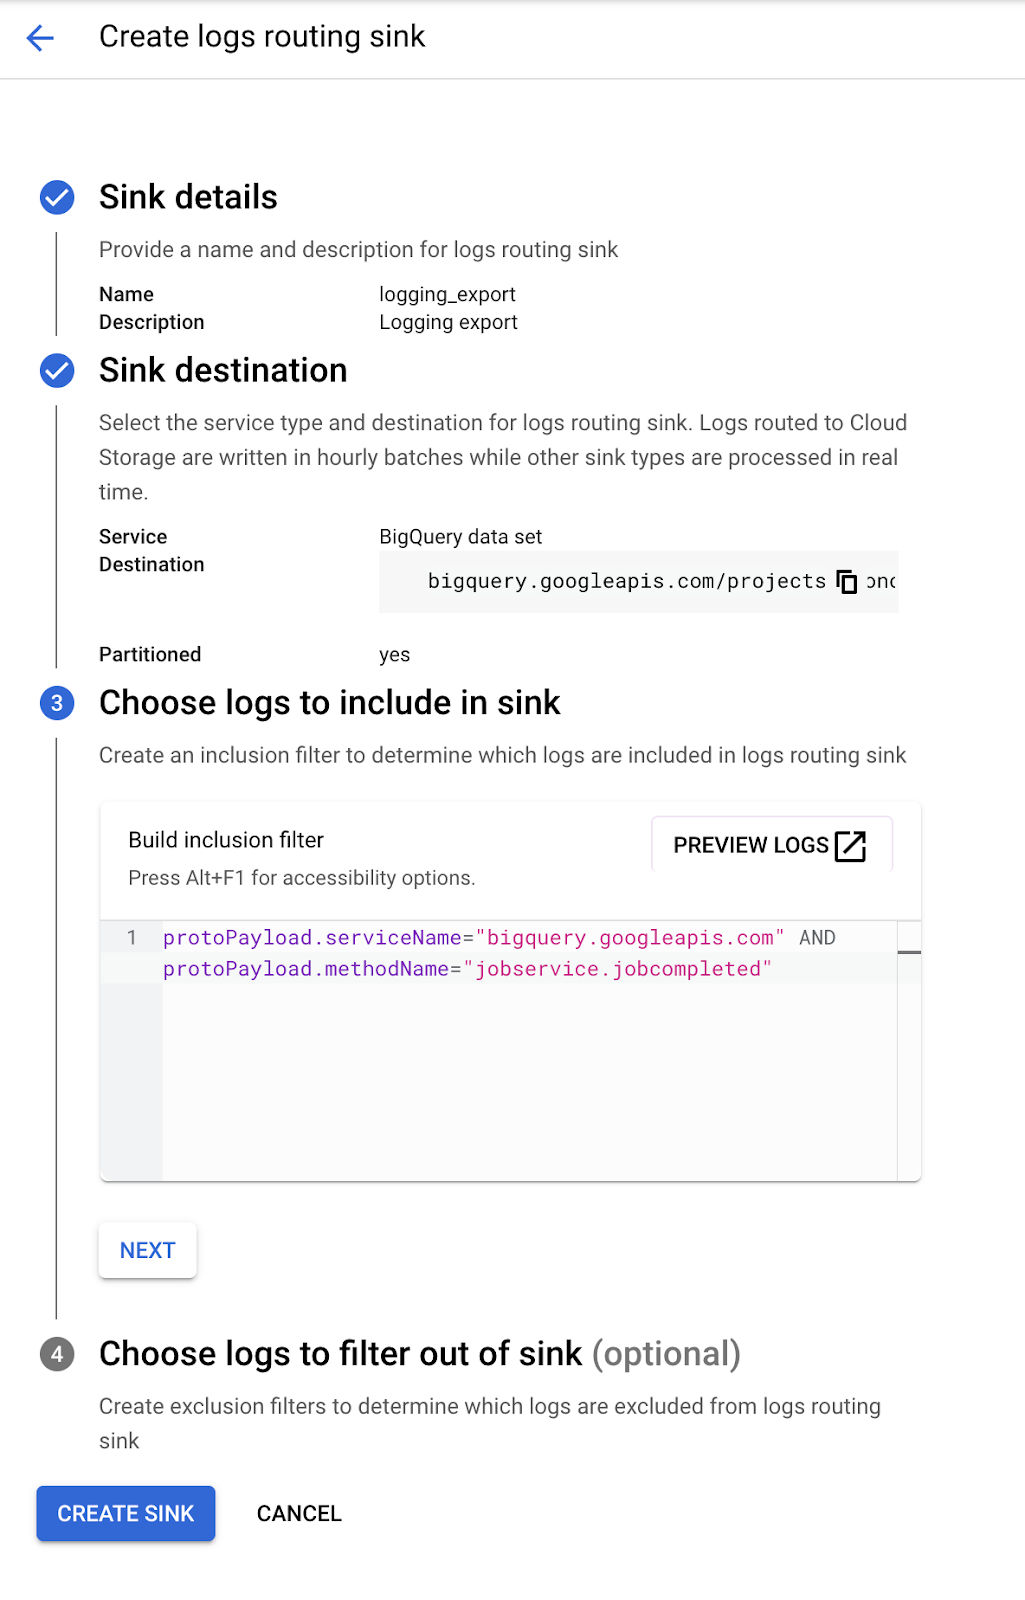 7. Leave the exclusion filter empty and click on **Create Sink**.
## Step 2: Integrate Logging sink with Economize
1. Navigate to the [**Projects page**](https://www.economize.cloud/app/settings/projects) from the settings of the Economize console.
7. Leave the exclusion filter empty and click on **Create Sink**.
## Step 2: Integrate Logging sink with Economize
1. Navigate to the [**Projects page**](https://www.economize.cloud/app/settings/projects) from the settings of the Economize console.


 5. Click on the **Save Changes** button.
{% hint style="success" %}
**SUCCESS**
You can now navigate to the [Reports](https://www.economize.cloud/app/gcp/reports) within the Economize console and start analyzing the BigQuery costs.
{% endhint %}
5. Click on the **Save Changes** button.
{% hint style="success" %}
**SUCCESS**
You can now navigate to the [Reports](https://www.economize.cloud/app/gcp/reports) within the Economize console and start analyzing the BigQuery costs.
{% endhint %}